Project · Maker
A backyard climate station and the health app it feeds
I built a weather and air-quality station in my backyard from a Raspberry Pi and separate sensors, and it has been recording since August 2026. Its readings feed EnviGuard, a web app I wrote that tells a person with asthma, heart disease or a pregnancy what today's air and heat mean for them, in plain words and in six languages.
- Roles
- Sole Builder (station) and Sole Developer (EnviGuard)
- When
- Jul 2026 to present; station recording since Aug 2026
- Live
- envi.myrondomain.com and its station dashboard
The problem
Air quality and heat forecasts are written for an average healthy adult. The Air Quality Index (AQI) number on a phone says "Moderate" to everyone who reads it, but the U.S. Environmental Protection Agency (EPA) rules behind that number already say people with asthma or heart disease should treat the same air differently. I wanted an app that applies those rules to the person reading it, in that person's language.
Regional forecasts are also models. They estimate conditions across a grid, and they can miss what is happening on one block.
Who it's for
People whose bodies react to bad air or heat before everyone else's do: people with asthma or chronic obstructive pulmonary disease (COPD), people with heart disease, pregnant people, young children and adults over 65. I added Spanish, French, German, Chinese and Japanese alongside English so a family member can read the advice in the language they think in.
What I built
The station
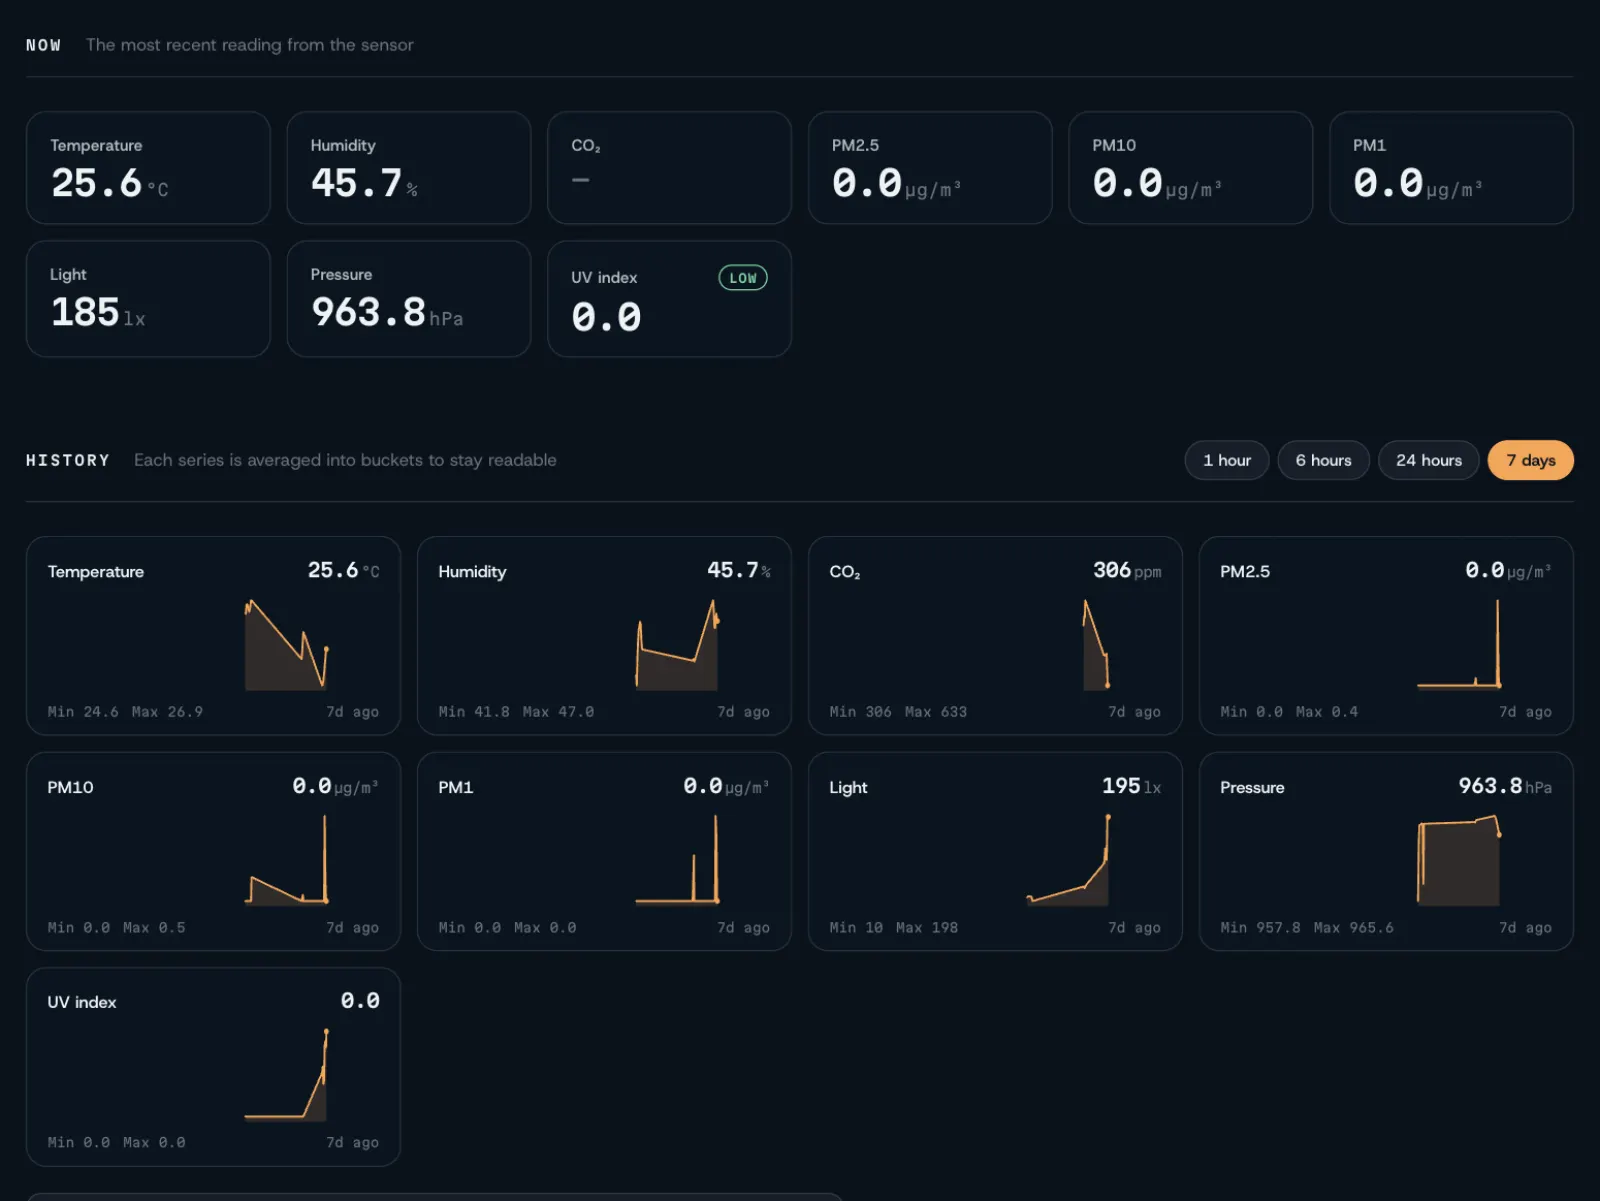
I designed and assembled the station around a Raspberry Pi, with a separate sensor for each kind of reading. It logs temperature, humidity, carbon dioxide (CO2), particulate matter (the fine dust and smoke particles that get into lungs), ultraviolet (UV) light, barometric pressure, wind and rainfall. A small collector program on the Pi sends readings to my server about every ten seconds, and the server keeps them in a database.
The station has its own public dashboard. It shows the latest value from each sensor and a chart of each one over the past hour, day or week.
The app
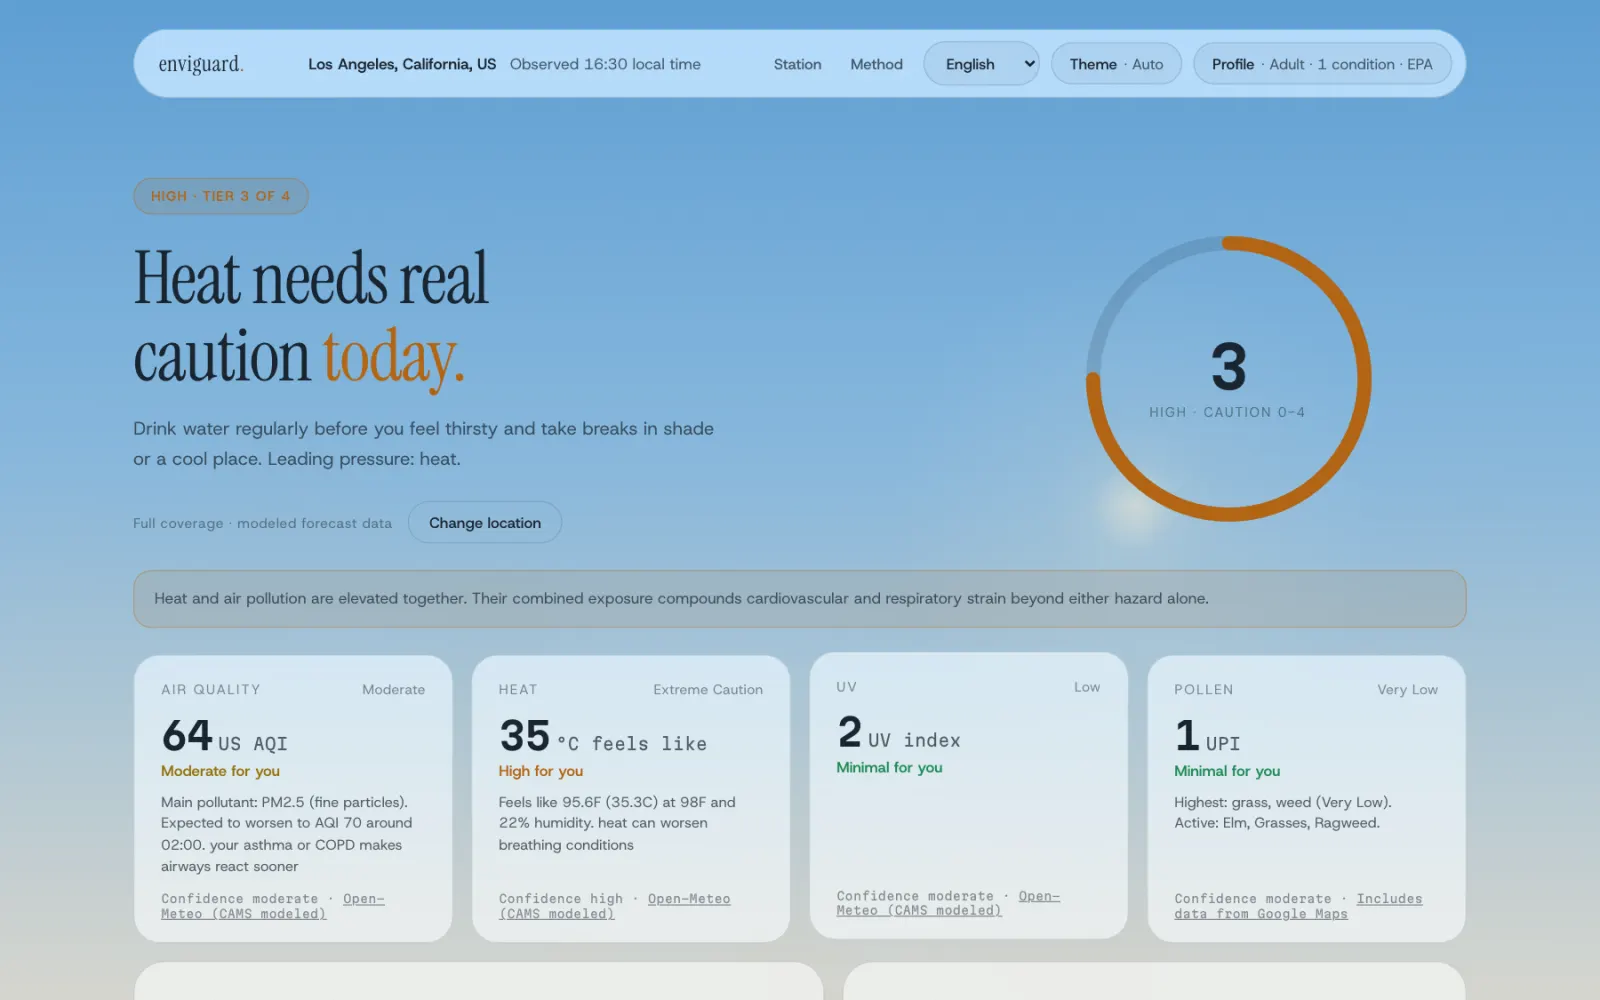
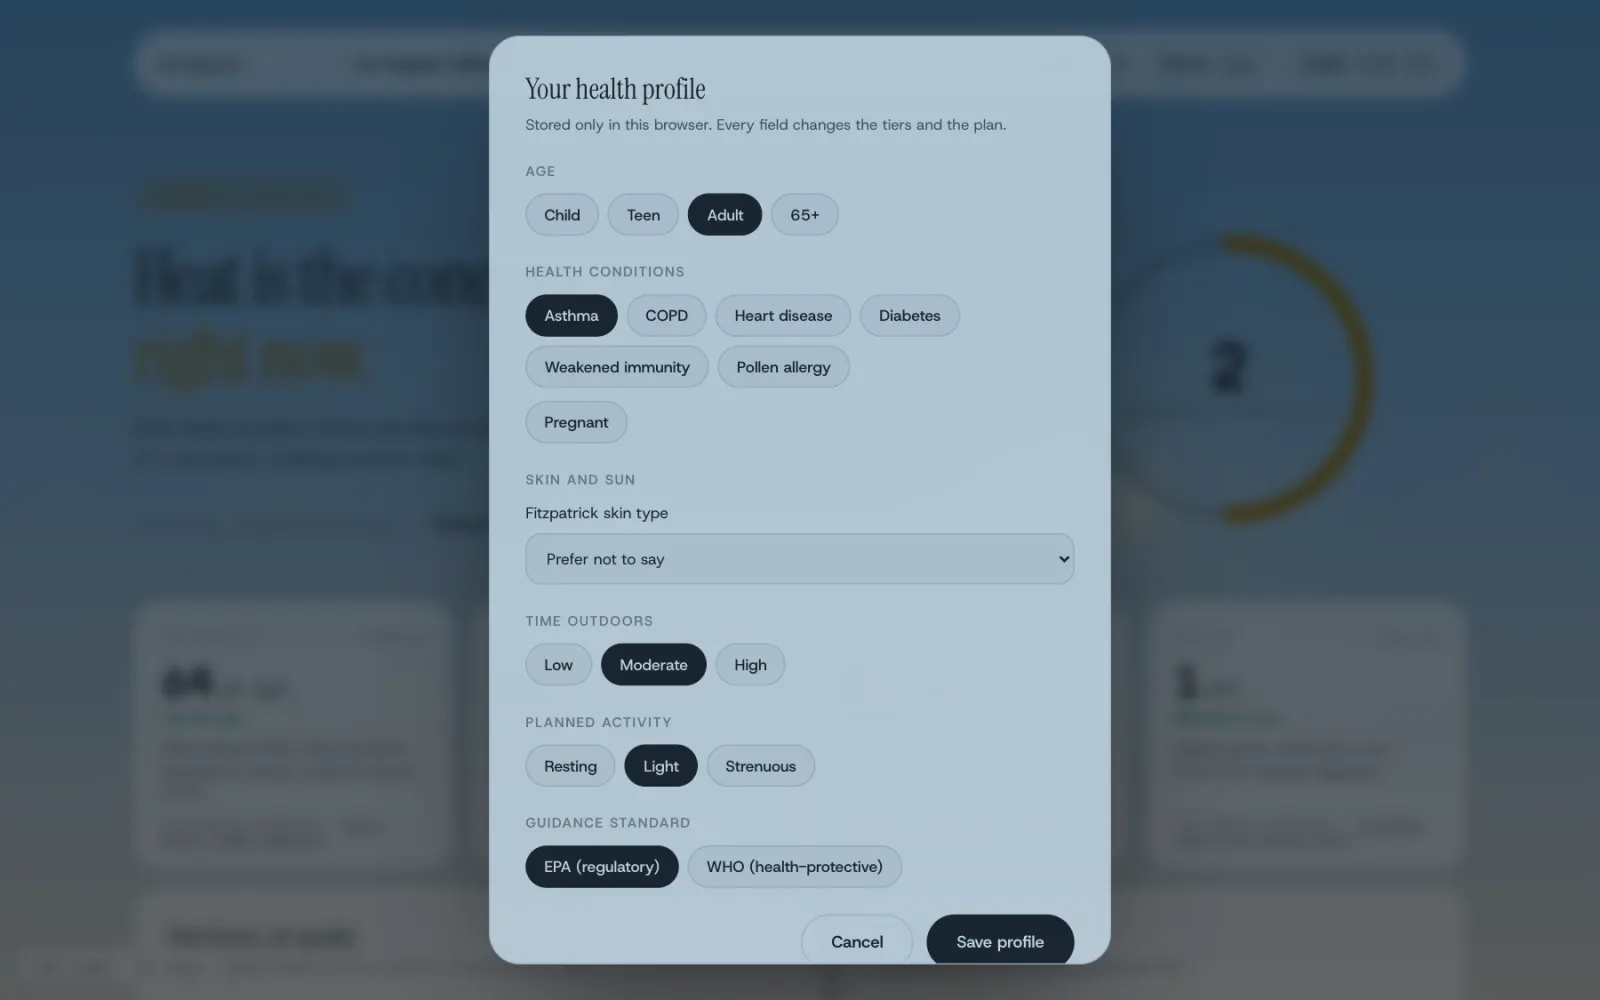
EnviGuard asks for a city or your location and a short health profile: age, conditions, skin type, how long you will be outdoors and how hard you will be working. It then gives one verdict on a 0 to 4 scale and a short plan, ranked so the most protective step comes first. The profile stays in the browser.
The profile changes the answer. On the afternoon of Oct 4, 2026 in Los Angeles, the AQI was 64 and it felt like 95.6°F. For a healthy adult, EnviGuard rated the day 2 of 4, Moderate. When I checked "Asthma" and saved, the same conditions became 3 of 4, High: heat moved to "High for you," air moved to "Moderate for you," and the air card added that asthma makes airways react sooner.
What happened
The station has been running since August 2026, and both the app and the dashboard are public at envi.myrondomain.com.
Running real hardware showed me failures a simulation would not. The carbon dioxide sensor sometimes reports exactly 0 parts per million (ppm) when a read fails. Left alone, the dashboard would headline that as "0 ppm, Fresh," which makes a broken sensor look like perfect ventilation. Outdoor air is around 420 ppm, so the server now throws away anything under 250 and treats it as a missing reading. I added similar range checks for every sensor, so one bad sensor drops out instead of taking the other readings with it. The Pi also has no reliable clock when it can't reach a time server, so the server accepts timestamps up to 30 days off but rejects ones that are obviously wrong, like a time in milliseconds that lands thousands of years in the future.
EnviGuard gives environmental guidance, and the app says plainly that it is not medical advice.
Under the hood
Station to server
The Pi runs Telegraf, which posts batches of metrics to an authenticated POST /api/ingest endpoint (a shared secret compared in constant time). The server stores one row per metric in SQLite. A fixed whitelist of field names controls what gets stored and what the history API will query, so no user-supplied string reaches SQL. The dashboard currently charts nine series: temperature, humidity, light, pressure, UV index, CO2, and particulate matter at 1, 2.5 and 10 micrometers. History is averaged into time buckets so a week of 10-second readings stays readable.
Risk engine
Each hazard (air, heat, UV, pollen) is first mapped to a base tier from its official scale: EPA AQI breakpoints and sensitive-group definitions for air, and the Centers for Disease Control and Prevention and National Weather Service (CDC/NWS) HeatRisk framing for heat. Sensitivity "bumps" from the profile (respiratory, cardiac, pregnancy, child, older adult, high exertion and others) then raise the tier, and every bump records a plain-language reason that the app shows. The rules are deterministic code, so the same inputs always give the same tier. No language model sets a tier. Users can switch between EPA and the stricter World Health Organization (WHO) guideline values.
Data and stack
Modeled air quality, weather and pollen come from Open-Meteo, with the Google Pollen API as a fallback. Each card shows its source and a confidence level. The server is TypeScript on Bun with a vanilla JavaScript front end, packaged with Docker. All six languages share one set of message keys, and a parity test fails if any language is missing a string. The repository has 74 automated tests across the risk core, the API, pollen fallback, translations and sensor ingestion.