Lead project
A wearable heart monitor that tells survivors of a heart-artery tear when exercise is too hard
People who survive spontaneous coronary artery dissection (SCAD) are told to avoid strenuous exercise, but nobody can tell them where "strenuous" starts for their own body. I built a system that pairs a chest-strap heart sensor with an Android app and judges each workout against the wearer's own resting heart, so the warning fits the person wearing it.
- Role
- Founder & Lead Developer (sole developer)
- When
- Jun 2025 to present
- Paper
- Institute of Electrical and Electronics Engineers (IEEE) Global Humanitarian Technology Conference 2026, sole author, presenting Oct 8, 2026
- Patent
- U.S. Patent Application 19/708,837 (pending)
- Status
- Working Android prototype; research tool, not a medical device
The problem
SCAD is a tear in the wall of an artery that feeds the heart. It can happen without warning, and after it heals, doctors usually tell survivors to stay away from vigorous exercise. That advice leaves a practical gap. A survivor on a treadmill has no way to know whether a brisk walk is fine or already too much.
A heart-rate number alone doesn't settle it. Two people can have the same heart rate during the same walk while their bodies are under very different strain. Resting heart rhythm also varies a lot from person to person, so a single cutoff that works for one survivor can be wrong for the next.
Who it's for
SCAD survivors and other cardiac-rehabilitation patients who want to stay active without guessing. Clinicians are the second audience: the app records labeled sessions they could review later.
What I built
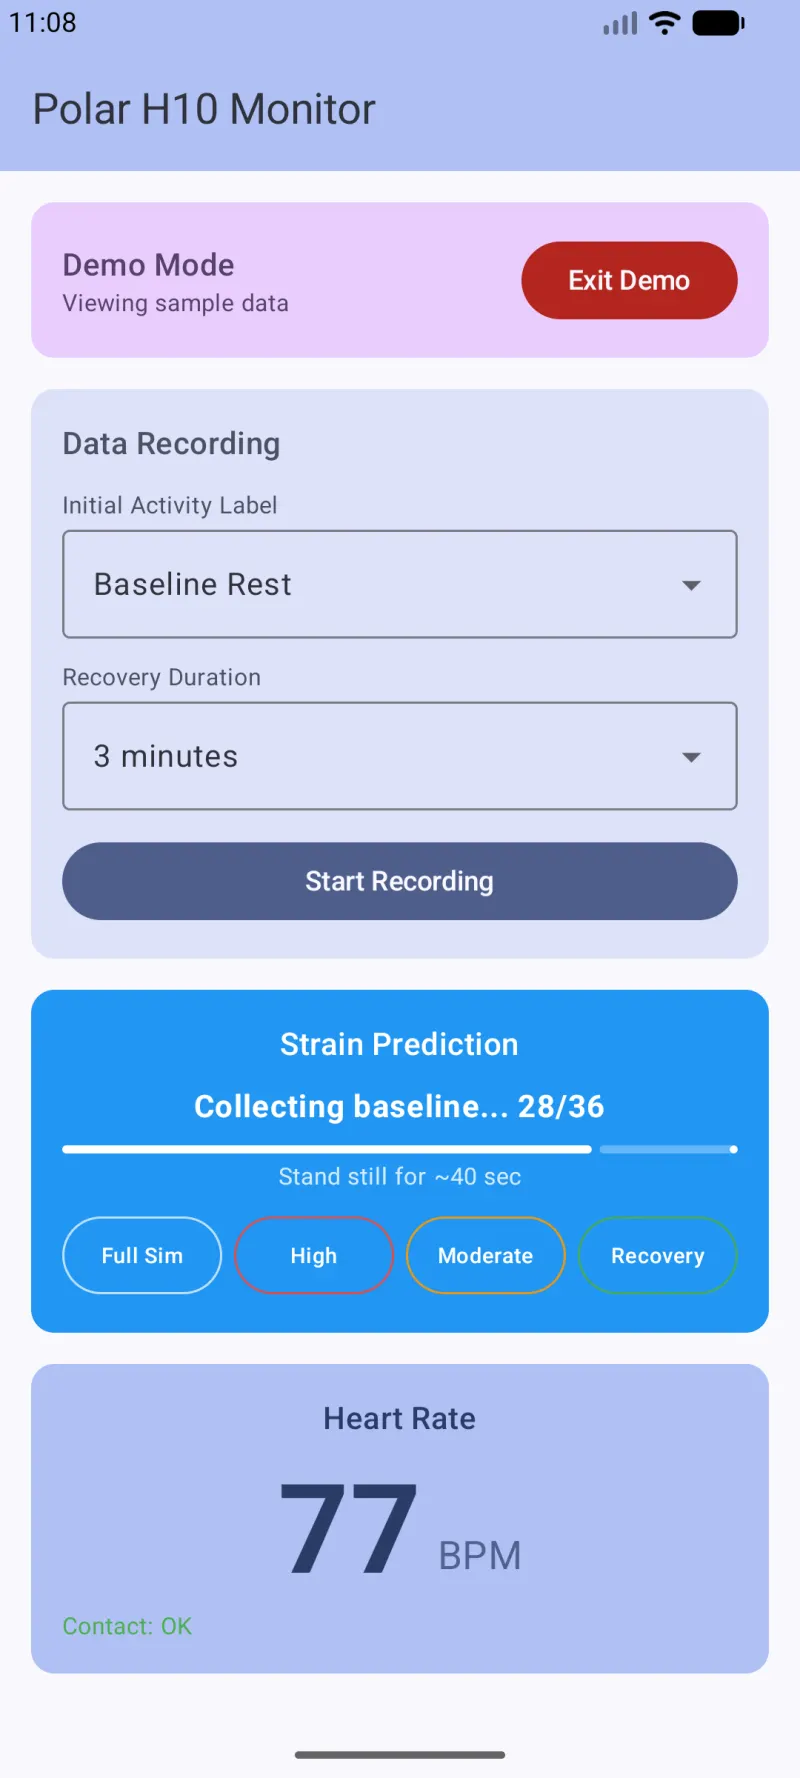
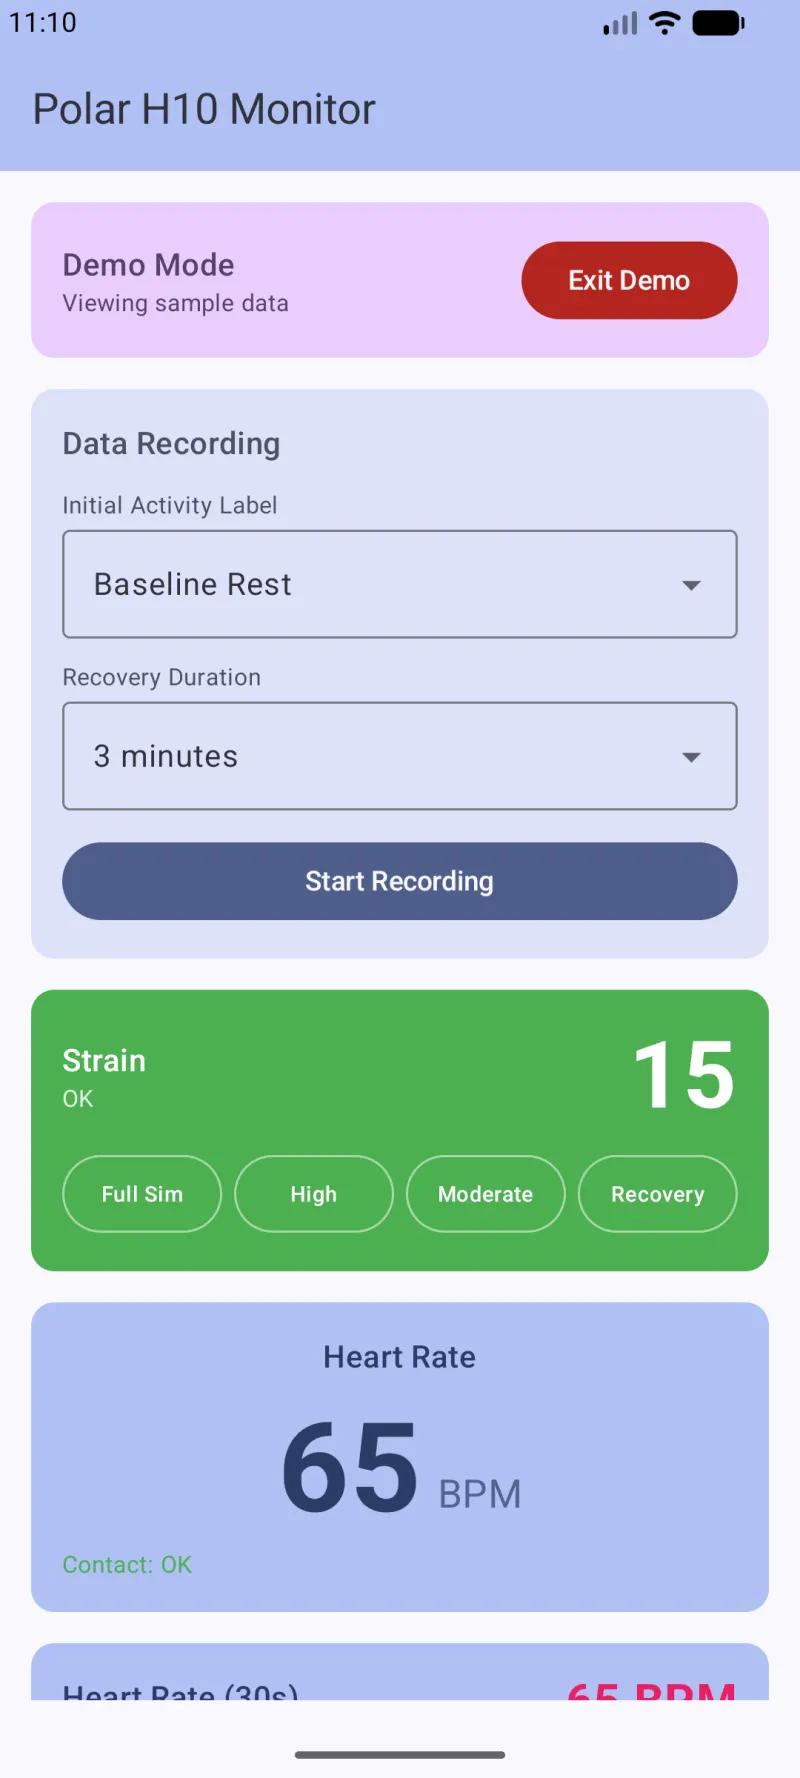
The wearer puts on a Polar H10, a chest strap that records the heart's electrical signal (an electrocardiogram, or ECG) and body motion. It sends those readings over Bluetooth to an Android app I wrote. Before exercising, the wearer stands still for about 40 seconds while the app learns their personal baseline, which is simply what their heart looks like at rest that day.
During exercise, the app compares every five seconds of data against that baseline. It watches how fast the heart is beating and how much the time between beats varies (heart rate variability, or HRV). A relaxed heart has more beat-to-beat variation, and under hard effort that variation shrinks. The app turns these into a strain score from 0 to 100. Below 50 the card stays green. It turns yellow, then orange as strain climbs, and goes red only when the score stays above 70 for three readings in a row, so one noisy reading can't set off an alarm.
The measurement that ended up mattering most is one I call the decoupling index. Normally heart rate rises and variability falls together. When heart rate keeps climbing after variability has already bottomed out, the two have come apart, and the index grows. In the dataset I studied, that mismatch carried more information about effort than either signal on its own.
What happened
I trained and tested the model on a public PhysioNet dataset of 22 healthy adults who were recorded sitting, walking and running. To check whether it works on strangers, I used a test called leave-one-subject-out: train on 21 people, then test on the one person the model has never seen, and repeat until each of the 22 has been the stranger once. Across all 22 rounds it identified whether someone was resting, walking or running 95.6% of the time. It was perfect on 12 of the 22 people. Its worst result, 69.7%, was on the person with the highest resting variability in the group, which is the kind of outlier a personal baseline is meant to handle.
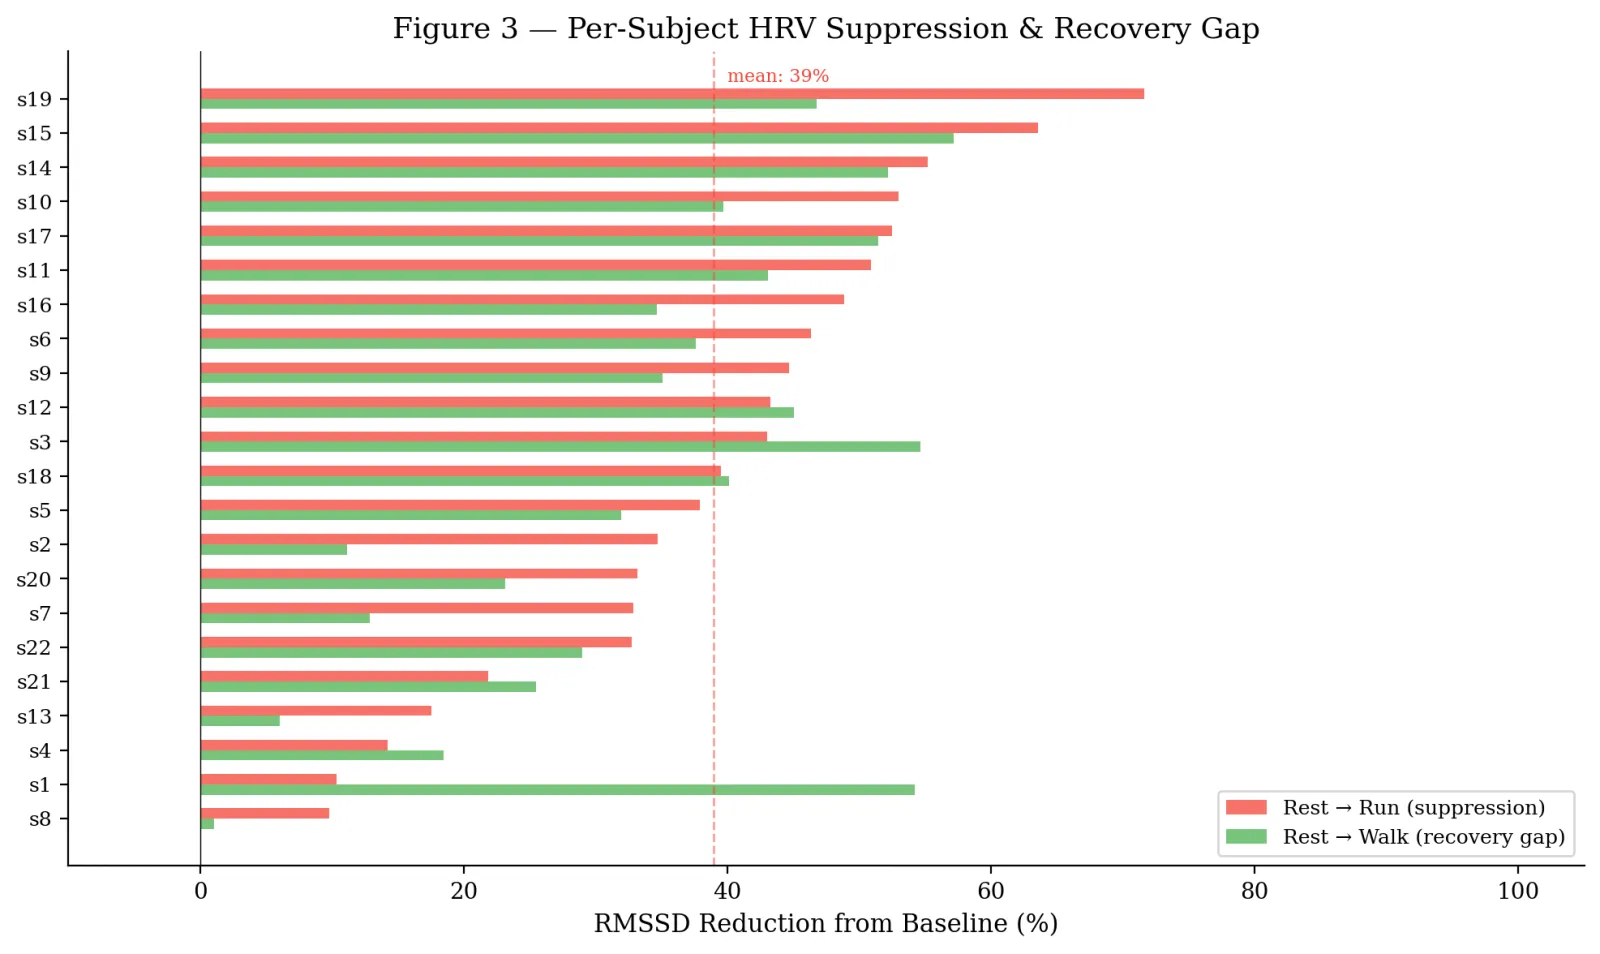
These results come from healthy volunteers in someone else's study, plus my own test sessions wearing the strap. No SCAD patient has used the app yet, and real patient testing would need medical oversight and an approved device.
In August 2026 a clinician who treats SCAD patients at Mayo Clinic reviewed the work and sent me feedback by email. That feedback shifted where the project is going next. Instead of a general strain alarm, I am now focusing on exercise guidance: helping a survivor see, during a workout, when to ease off.
- 1st Place, Applied Computational Science, and Grand Award Finalist, Los Angeles County Science & Engineering Fair (1st of 40 in category, top 17 of 800+ projects)Mar 2026
- 1st Alternate to the International Science and Engineering Fair (ISEF)2026
- U.S. Patent Application 19/708,837, "Personalized cardiovascular resilience & physiological monitoring system" (pending)Jun 2026
- Sole author and presenter, IEEE Global Humanitarian Technology Conference: "A Personalized Heart Rate Variability Based Framework for Wearable Monitoring of Exercise-Induced Cardiovascular Stress"Oct 8, 2026
Under the hood
App
Kotlin and Jetpack Compose on Android, using Polar's official Bluetooth Low Energy (BLE) software development kit (SDK). The app streams heart rate, R-R intervals (time between beats), ECG at 130 Hz and three-axis accelerometer data at 50 Hz. It computes RMSSD (root mean square of successive R-R differences, a standard short-term HRV measure) on a rolling buffer, records labeled sessions with treadmill speed, incline and perceived exertion, and runs the trained model on the phone through ONNX (Open Neural Network Exchange) Runtime, so nothing goes to a server. The feature and baseline code has unit tests.
Data and features
Training data is the Pulse Transit Time PPG (photoplethysmogram) Dataset (Mehrgardt et al., 2022) on PhysioNet: 22 healthy subjects, sitting, walking and running, with ECG and accelerometer at 500 Hz. A Python pipeline cuts the recordings into 5-second non-overlapping windows: 25,715 windows, 25,711 after dropping windows with missing cardiac data. Each window starts with 6 raw features (mean heart rate, mean R-R interval, RMSSD, accelerometer magnitude, RMS (root mean square) and mean absolute deviation). I added 19 more: values relative to each subject's sitting baseline, rolling trends over 15- and 25-second lookbacks, and cross-signal interaction terms. The decoupling index is one of those interaction terms: percent heart-rate change from baseline minus RMSSD expressed as a percent of baseline.
Validation
A modality ablation with a Random Forest under stratified 5-fold cross-validation gave 99.0% with both signal types, 97.4% with accelerometer features only and 74.2% with cardiac features only. Those 5-fold numbers are inflated because windows from the same person land in both training and test sets. The number I report is 22-fold leave-one-subject-out cross-validation with a gradient-boosted tree classifier: 95.6% accuracy, F1 = 0.956. Rest was classified almost perfectly; most errors were running mistaken for walking (767 windows) and walking for running (362). The decoupling index accounted for 90.3% of feature importance and heart rate times accelerometer magnitude for another 8.0%, so a two- or three-feature model would probably run nearly as well on a phone.
Limits
The model classifies activity state (rest, walk, run) from healthy volunteers' data; it has not been validated against clinical outcomes or on SCAD patients. Protocols in the dataset were short. My own recordings are a handful of test sessions, used to check the live pipeline, not to train the model.
Stack: Kotlin, Jetpack Compose, Polar BLE SDK, ONNX Runtime; Python, pandas, scikit-learn, skl2onnx, Jupyter, matplotlib.